We often get asked "How can I eliminate panic in my Rust?" There have been several attempts to tackle this issue. For Microsoft under the Open Device Partnership we have released the Call Graph Analyzer (CGA), a tool to extract the callgraph from monomorphized MIR. This callgraph can be used to track down what functions in the compiled binary can panic.
We often get asked "How can I eliminate panic in my Rust?" There have been several attempts to tackle this issue. For Microsoft under the Open Device Partnership we have released the Call Graph Analyzer (CGA), a tool to extract the callgraph from monomorphized MIR. This callgraph can be used to track down what functions in the compiled binary can panic.
For example, when you run cargo cga check on your code, you get:
error: call to method `core::num::<impl u64>::strict_sub` which can panic
  --> src/main.rs:18:17
   |
18 |         let _ = 2u64.strict_sub(u64::MAX);
   |                 ^^^^^^^^^^^^^^^^^^^^^^^^^
In this blogpost we discuss why this new approach is both better and worse than pre-existing approaches.
Why eliminate panics though?
Before discussing the Call Graph Analyzer, we should first consider why panics are useful, and in what cases it might be beneficial to minimize or perhaps even completely eliminate any possible panic. This topic has been explored extensively by others [1][2][3][4], but it is useful to summarize here. Lets start with a brief description:
Rust provides a mechanism to prevent a function from returning normally, and instead “panic,” which is a response to an error condition that is typically not expected to be recoverable ...
These unrecoverable error conditions may either be caused by a bug in the implementation of a function, or constitute violated entry conditions for a function (so a bug in the function itself or a mistake by the caller of that function).
An example is calling 1.strict_add(u32::MAX), which would result in a panic in response to the caller passing invalid arguments to the operation. Similarly a normal addition 1 + u32::MAX in Rust will panic if overflow-checks are enabled.
Instead of panicking, error conditions can be dealt with by:
- making them recoverable by having the function return a
Result<T, E>orOption<T>instead. For addition this is provided byu32::checked_add. - making the function fail implicitly or silently and describing that behaviour in the function documentation. Arithmetic operations can for example wrap around with
u32::wrapping_add. - making a function never return, e.g. using an infinite
loop {}. Sometimes this approach is accidentally used when employing a retry scheme without a timeout or maximum iteration count.
However striving for zero panics is very hard and quite foolish: code is rarely void of assumptions. Returning Result<T, AssumptionViolated> everywhere just pushes the burden up the call stack, until you will abort anyway at the root. This essentially yields the same behaviour as if you were to panic.
It is useful to make panics explicit though. It is better to know about your panic paths and to reason about them, than to just accidentally include panics and ignore that they exist. Having regression analysis on your panic paths is also very useful, notifying you of any new panic paths introduced in your code.
Having said that, in the following cases it might be justified to eliminate some of your panics:
- In contexts where code size really matters, like on embedded devices. Panics result in a relatively large amount of code due to the required strings and associated code to format these strings. Instead, we can:
- use
defmt::panicto reduce this string bloat. This requires all panics to be wrapped in the macro. For library dependencies this is typically only done when the library is specifically intended to be used on an embedded platform. Defmt is not used in other libraries, including the standard library of Rust. - use
-Cpanic=immediate-abortto prevent panics from being emitted entirely and instead just crash the application. This does not leave a lot of information that can be used for debugging though.
- use
- In critical code paths that must absolutely never fail, for example:
- an externally accessible service that needs to prevent a Denial of Service (DOS) attack which crashes the service. Invalid input should result in a user-facing error instead.
- the firmware update path on an embedded device, including the bootloader.
- In panic handling code itself. In Rust when unwinding a panic in an implementation of
Dropcauses a so-called 'double-drop' and may cause the program to abort. Secondly a panic in a custom#[panic_handler]is not allowed, but it is unclear what should happen then.
Striving for no unrecoverable error conditions is extremely hard in practice. Generally it is better to implement top-level recovery mechanisms. In embedded this would entail using a Watchdog timer which resets the device if it is stuck, and a recovery image to restore the device to a working state. On a host machine this could mean catching unwinding panics using catch_unwind. Note that the latter is not fool-proof and comes with a few caveats. Externally accessible services should be redundant and fast to recover.
In conclusion, it is useful to find unintentional panics.
Prior art
Currently, ways to extract callgraphs or detect panics include:
- rustig (ELF debug info analysis)
- findpanics (ELF debug info analysis)
- cargo-callgraph (Rust HIR analyzer)
- cargo-callgraph (rust-analyzer based exporter)
- charon (Rust MIR exporter)
- no-panic (Linker-based panic detection)
- dont_panic (Linker-based panic detection)
You can download any of these projects, and with the exception of Charon (which is not explicitly meant for this usecase) it is very easy to get started.
Linker-based panic detection methods work by triggering an error in the linker when it tries to link in a special panic handler. This detection approach only works if not a single panic is included in your binary. It also only works on binaries and not on libraries.
ELF debug info analysis looks at the DWARF debug info that is included in ELF artifacts like binaries and Rust libraries compiled to object files. It is limited in what callgraph information it can provide: the panic machinery can be completely inlined or disappear during the linker phase.
And finally we have HIR, MIR and rust-analyzer based approaches, which use the various Intermediate Representations (IRs) of your code generated by the compiler (and rust-analyzer) to extract the callgraph from. In a sense all these approaches take your original Rust code, have the compiler process it, and spit out what it thinks is happening. Theoretically these approaches work on any Rust crate.
The HIR-based analysis can only analyze the code in your specific crate. This analysis can check if you explicitly write panic! in your own crate. However, it is unaware of any code in your dependencies, such as the standard library. Hence it can not trigger on panics that occur within dependencies. The compiler can also insert assertions like bound checks, which are not even a call to panic until very late in the code generation pass depending on your compiler flags.
The MIR-based analysis is ideal, as it can theoretically see all code from dependencies, before they are optimized away, including panics originating in the standard library. Hence Call Graph Analyzer uses this approach. The only downside is that this analysis is done before LLVM is able to remove unreachable code, and hence we get some false positives.
All these previous approaches take what the compiler is already doing when compiling your crate, and interrupt the compilation process to look at a snapshot of the compilation state to find out whether you are calling a panic.
The rust-analyzer approach is slightly different, as it does not depend on the compiler at all. Rust-analyzer has duplicated the Rust-HIR-MIR pipeline from the compiler, which they adapted for their process. This separate pipeline for rust-analyzer is pretty fast, can be stored in memory and supports updating the state while you are actively writing and changing your Rust code. However, it can not always analyze code that rustc is happy to compile. Most notably it often struggles with complex proc_macros like we use a ton of in Rust Embedded. As an end-user you notice this when your code editor stops giving any helpful suggestions. (The team behind rust-analyzer is working hard to prevent this!) The upside of rust-analyzer is that it does not depend on the Rust compiler.
How CGA works
For our usecase we needed a method that:
- detects any and all panics
- allows configurable parts of the binary to panic
- is compatible with async Rust (as all async blocks have an implicit panic path)
- works well with Embedded Rust
We decided on a MIR-based callgraph exporter, which became the Call Graph Analyzer (CGA). Next up, we will discuss the design and functionality of CGA.
rustc-driver
CGA extracts the callgraph directly from MIR as a rustc-driver. Clippy similarly is a rustc-driver. Like Clippy, CGA therefore depends on a specific version of the rust compiler, which gets us to the first real downside of CGA:
A note of caution: CGA compiles your crate with a specific (probably different) version of the rustc compiler, standard library, and potentially different compiler flags. Hence you will not get the exact callgraph as included in your binary.
Having a specific (nightly) version of rustc as a dependency using rustc-private also means that CGA can not be installed as a crate from crates.io. Instead the repository needs to be checked out locally, after which cargo install --path . needs to be run (which uses a specific version of the Rust toolchain automatically).
This user experience might be improved when rustc_public contains everything that CGA needs. Though, that scenario isn't really likely. Instead, if CGA becomes popular enough, it might be maintained alongside rustc, just like Clippy currently has this special status. Any breaking change in rustc is also applied to Clippy, and you can install Clippy for your specific toolchain using Rustup. For more information on this, you can watch the excellent talk on "Out of tree access to the compiler state" by Alona Enraght-Moony.
As a rustc-driver, the CGA binary has the same API as rustc itself. You can use cargo to run CGA using cargo cga check. Internally rustc will run as if you were to run cargo check. However CGA does some additional work to gather the call graph, which for a typical crate means that compilation with CGA is roughly 2x-3x as slow as running cargo check.
MIR traversal
When CGA is done running all the compiler passes that are normally part of cargo check, it forces the compiler to yield all so-called roots or entrypoints of your crate. Intuitively, this is any part of your crate that is accessible from the outside when compiled. These include:
fn mainand variants thereof- the language
_startsymbol - functions that are marked
externwhich have a stable name usingno_mangleorexport_name, including interrupt handlers for Embedded Rust.
For this analysis we are explicitly not interested in all the functions that are compiled as part of const blocks, including static value initialization, as only the outcomes of these computations are included in the final binary.
From these roots outward we perform a reachability analysis by walking through the MIR tree. Every time a function is called, that function is also explored. Thus all unused functions are not visited. In Rust, like in C++, a function with Generic arguments is monomorphized when it is called using the concrete types used to call it.
Thus we do not only gather the called functions, but the concrete instantiation of each function, as the implementations can differ wildly depending on the type arguments passed.
This process gets a little bit tedious when considering:
dynobjects, for which it is unclear which trait implementation is actually being called. CGA assumes all vtable entries are called for that function when it finds one. This gets especiallyfunlarge when a dyn object is constructed for standard library traits like theDebugtrait.- function pointers can be created from Rust functions. We can not necessarily reason about what happens with these pointers. Thus we assume any created function pointer will be called at some later stage.
- each
asyncblock has a panic path, implicitly. See the blogpost "Async Rust never left the MVP state" by Dion for more on this.
Extracting a graph
After walking through the MIR tree of your crate and its dependencies, we get a collection of callgraphs. We can now choose to either extract them to JSON or GraphViz dot files, or to check them for any panics or blacklisted functions.
When extracting, all the callgraphs are put in your /target folder as <crate>.callgraph.json. We finally merge them together and export the global callgraph with separate roots using:
cargo cga extract -Tdot -o callgraph.dot
To quickly illustrate what this looks like, please consider the following example using dyn objects:
trait Test {
    fn test(&self) {
        panic!("Default impl")
    }
}

struct StrictAdd;
impl Test for StrictAdd {
    fn test(&self) {
        let _ = 2u64.strict_add(u64::MAX);
    }
}
struct StrictSub;
impl Test for StrictSub {
    fn test(&self) {
        let _ = 2u64.strict_sub(u64::MAX);
    }
}

struct DefaultImpl;
impl Test for DefaultImpl {}

fn main() {
    let object = StrictAdd;
    let dyn_object: &dyn Test = &object;
    dyn_object.test();
}
This results in a graph with an arrow for every entry in the vtable:
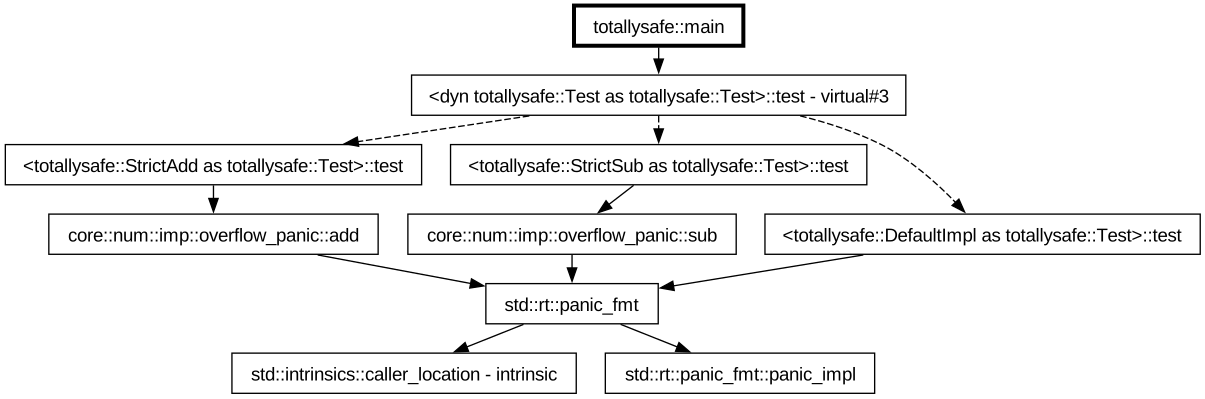
Image 1: Graphviz Callgraph example (you can zoom in for better readability)
As you can imagine, this quickly becomes quite large and unreadable. If you have a suggestion for a GUI application that can meaningfully display callgraphs, please reach out as that would be very helpful!
Linting and diagnostics
Secondly, like Clippy, we can ask CGA to check our code for any panic paths by running:
cargo cga check
This will take the callgraph, find panic paths, and will try to give a helpful insight in how this panic path relates to your crate. One of the lints emitted for the above code looks like this:
error: call to method `core::num::<impl u64>::strict_sub` which can panic
  --> src/main.rs:18:17
   |
18 |         let _ = 2u64.strict_sub(u64::MAX);
   |                 ^^^^^^^^^^^^^^^^^^^^^^^^^
   |
   = note: 3 different panics from this location
   = note: backtrace (1 of 2):
           0: std::rt::panic_fmt (called)
           1: core::num::imp::overflow_panic::sub (called)
           2: core::num::<impl u64>::strict_sub (called) <--
           3: <totallysafe::StrictSub as totallysafe::Test>::test (possible vtable resolution)
           4: <dyn totallysafe::Test as totallysafe::Test>::test - virtual#3 (called)
           5: totallysafe::main (entrypoint)
Note that it shows the backtrace, along with the possible vtable resolution, and the last call from our current crate context. These diagnostics are generated heuristically, meaning that out of all the panic paths, we choose a single one for each callsite in our local crate. We try to choose the best of all these paths using a scoring mechanism.
White- and blacklisting
For any serious crate that was not developed with minimizing panics in mind, the amount of lints generated by CGA is not really manageable. To help with this, CGA comes with a few configurable parameters.
As an example, if you trust a function to not panic (even though panic paths are being emitted for it), you can add the function to the whitelist. Any panic path that includes that function will be ignored. These rules can match on both simplified function names as well as full canonical Rust paths with all generic parameters included.
Alternatively, functions can be put on a blacklist. Besides panics, if you want a crate and its dependencies to never use some function, it is possible to exlude it. For example, you might want to exclude interaction with the filesystem, the network or processes.
blacklist = [
    { path = "^std::process::" },
    { path = "^std::fs::" },
    { path = "^std::sys::" }
]
An example of a cga.toml configuration file
Then if we feed the following program to CGA:
fn test() {
    let _ = std::process::Command::new("evil");
}

fn main() {
    test();
}
We get the following:
error: call to associated function `std::process::Command::new` which is blacklisted
 --> src/main.rs:7:13
  |
7 |     let _ = std::process::Command::new("evil");
  |             ^^^^^^^^^^^^^^^^^^^^^^^^^^^^^^^^^^
  |
  = note: 101 different blacklisted functions from this location
  = note: backtrace:
          0: std::process::Command::new::<&str> (called) <--
          1: fail_blacklist::test (called)
          2: fail_blacklist::main (entrypoint)
note: the lint level is defined here
 --> src/main.rs:3:11
  |
3 | #![forbid(cga::blacklisted)]
  |           ^^^^^^^^^^^^^^^^

error: call to drop of `std::process::Command` which can call blacklisted functions
 --> src/main.rs:7:47
  |
7 |     let _ = std::process::Command::new("evil");
  |                                               ^
  |
  = note: 101 different blacklisted functions from this location
  = note: backtrace (1 of 20283553):
          0: std::sys::fs::unix::debug_assert_fd_is_open (called)
          1: <std::os::fd::OwnedFd as std::ops::Drop>::drop (called)
          2: drop of `std::os::fd::OwnedFd` (called)
          3: drop of `std::sys::fd::unix::FileDesc` (called)
          4: drop of `std::sys::process::unix::common::Stdio` (called)
          5: drop of `std::option::Option<std::sys::process::unix::common::Stdio>` (called)
          6: drop of `std::sys::process::unix::common::Command` (called)
          7: drop of `std::process::Command` (called) <--
          8: fail_blacklist::test (called)
          9: fail_blacklist::main (entrypoint)
Note that this feature does not actually preclude a process from being spawned in any of your crates or dependencies: within Rust it will forever remain possible to link to some external object file or use assembly directly, which CGA can not analyze. Blacklisting with CGA is, however, an interesting capability.
Caveats
Having detailed what CGA can and can not do, it is useful to know there are some caveats and downsides to the approach CGA uses.
Fragile
Traversing monomorphized MIR is not trivial. Resolving vtables is quite finnicky; the compiler inserts shims sometimes and actual calls are inserted later; coroutines need to be unpacked to find the async paths; and there are implicit assertions which eventually also end up being a panic. All of which is to say: the analysis is hard and it is inevitable that some parts of it are not completely correct. When the toolchain is updated, the resulting MIR can vary dramatically, which also has an impact on the call graph. It might be that down the line some part of the analysis breaks if rustc works differently.
This is to be expected: Rust MIR is unstable and will remain to be so for the foreseable future. Consequently CGA will be a bit fragile.
Optimizations
Depending on your compiler flags but in particular your opt-level, the MIR CGA gathers contains panics that are unreachable.
For example, the expression 1 + 1 has an implicit overflow bounds check included. If you were to const evaluate the expression, it is exceedingly obvious that the expression can never panic. With opt-level=2 (optimize for speed) this expression is optimized to 2 by an earlier compiler pass before CGA gets the MIR. However with opt-level="z" (optimize for size) this panic path is included in the MIR. Instead, the optimization is left to LLVM to perform (which it does).
Your compiler and cargo options really matter with regards to the callgraph being emitted, similarly to how they matter to the final binary generated by rustc and the linker.
I advise people to use opt-level=2 for CGA, even if the shipped binary uses something different, as generally no reachable panic will be missing with opt-level=2 (thus fewer false positives and no false negatives).
Tooling expects rustc
CGA has been tested on a few real-world binaries, and typically it works out of the gate. Sometimes however it does not. This is either because the project does not compile with build-std yet (which CGA requires), or because the build.rs expects the application to be built with stock rustc and not with a rustc-driver like CGA (example).
If CGA does not work for your project, or if the callgraph does not seem to be correct, please open an issue! The tooling can only evolve by testing it against real software.
Try it out
With Call Graph Analyzer (CGA) you can extract callgraphs and detect panics. If you were wondering how many panics your application secretly contains, even though you are not using unwrap, give it a spin and let us know what you find!
A special shoutout to Jyn for this blogpost and the work by Ferrocene, which heavily inspired our work on the Call Graph Analyzer.